This map
above shows the
difference between current
observed hourly conditions and
predicted monthly conditions for
the global ionosphere.
Depressions and enhancements are
with respect to the
SWS
predicted monthly T index for
that month.
The map above
shows the difference between current
observed hourly conditions and
predicted monthly conditions for the
Australian region. Depressions and
enhancements are with respect to the
SWS predicted monthly T index for
that month.
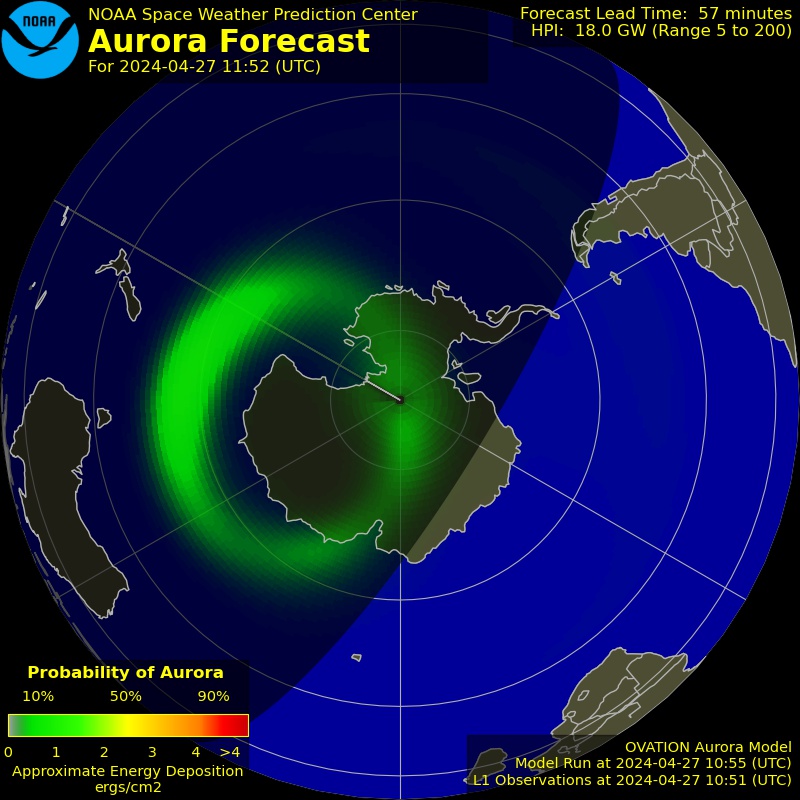
Colour
Conditions
blue
enhanced
green
normal
yellow
mildly depressed
red
depressed
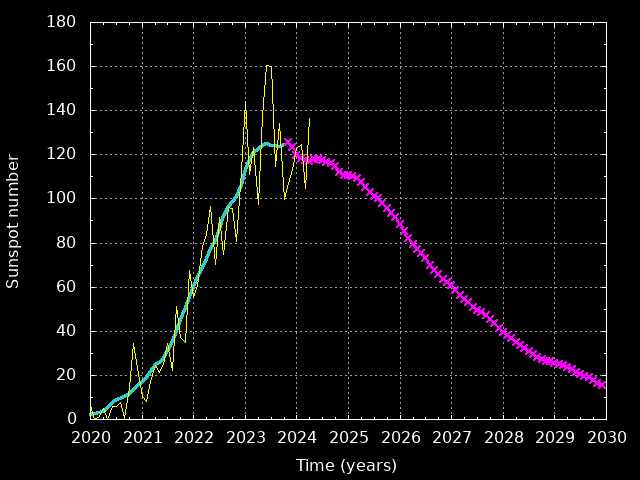
Solar Activity Plot
Monthly Sunspot Numbers
Estimated Planetary K Index
Estimated K Index for Australia
Explanation of Space Weather and its effect
on Communications